 |
Sun’s Magnetism Marina GIGOLASHVILI, Dr. of Sciences |
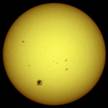
The Sun is a “usual” star, but a star, nearest to us. That is why we see it as a bright disk, whereas other stars are only twinkling points in the night sky. We cannot see disks of stars not only visually, but also using the most powerful telescopes. We cannot also see such details with which various atmospheric layers of the Sun abound: sunspots in the photosphere, prominences, filaments, floccules and flares in the chromosphere, coronal rays and streamers and such a powerful phenomenon as coronal mass ejection (CME) in the corona. So the Sun is an excellent physical laboratory, in which Nature carries out inconceivable experiments, which need to be investigated and interpreted, and also generalized for study of all other stars. | |
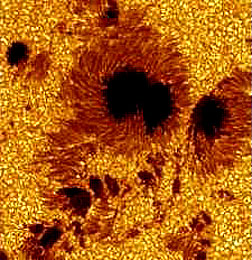
Figure 1. Sunspots on the solar surface made through a Swedish solar telescope. |
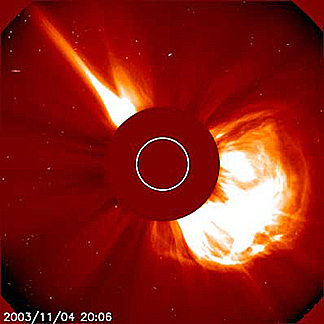
Figure 2. Coronal mass ejection.The largest and |
|
Everything changes continuously on the Sun. There are active areas, which develop, then destroy and disappear with an 11-year periodicity. 
Figure 3. Frequency of occurrence of sunspots, measured for 1915-2000. A plot of the number of sunspots observed on the face of the Sun shows this number varies cyclically with a mean value of about 11 years. | |
|
Solar magnetism is of especial interest. If the Sun had no magnetic fields, “frozen in” plasma, it would be always constant and stable. But there are magnetic fields on the Sun: a common magnetic field (1-2 G), as well as local magnetic fields sometimes reaching up to 1-5 K G. 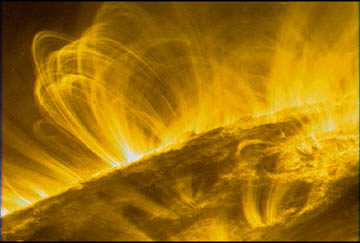
Figure 4. Solar Flare. TRACE (Transition Region and Coronal Explorer) image. | |
|
The strongest magnetic fields are observed in sunspots, which are characterized by one strange feature. In each solar hemisphere, all leading spots in bipolar groups as well as recurrent spots have a magnetic polarity sign of the circumpolar area of this hemisphere, while the following sunspots have an opposite polarity. After about 11 years, as if by magic, the situation gets opposite, i.e. the leading and following sunspots change polarity, as do the circumpolar areas of the Sun. The polarity reversal is not instantaneous, but involves a complex restructuring of the magnetic field, which appears to take at least several months. Changing polarity of sunspots and circumpolar areas keeps up during an 11-year cycle. Therefore a complete magnetic cycle contains two 11-year cycles (Hales’ cycle). But the polarity of the circumpolar areas varies just at the maximum of solar activity, i.e. a new solar cycle originates before all events of the previous cycle have terminated. There is also a threefold polarity reversal only once during one Hales’ cycle. It should be noted that it take place only in one of solar hemisphere. In other cases there is only a “usual” or single reversal. The threefold reversal took place in the southern hemisphere alone in cycles 12, 14 and in the northern hemisphere alone in solar cycles 16, 18 and 20. The single reversals took place in the odd Cycles. At the beginning of a new cycle sunspots appear at high latitudes. During the cycle they drift to the equator. Thus there exist periods, when on the photosphere both high latitudinal sunspots with a new polarity and low latitudinal sunspots of an old cycle near to the equator are observed simultaneously. 
Figure 5. The Butterfly Diagram sunspot latitude. Sunspots are concentrated in two latitude bands on either side of the equator. A butterfly-like pattern in the diagram shows the motion of sunspots toward the solar equator. | |
|
There are also the “avoidance zones” for sunspots: one can seldom see sunspots at latitudes above ± 40° and below ±5° . An occurrence zone for sunspots is named “the royal zone”. But not only sunspots are an expression of solar activity, though they generally better than all other solar formations characterize activity of our star. The active regions (AR) are multi-layer formations in the solar atmosphere penetrated by magnetic lines. The most dynamic processes on the Sun are connected to solar wind, which carries into interplanetary space part of the Sun's magnetic field, creating an interplanetary magnetic field (IMF). In figure the structure of solar wind is given. Along the solar equator the velocity of wind is about 400 km/s. At high latitudes solar wind has a velocity of 700-800 km/s. The IMF lines are "frozen in" the solar wind plasma. The IMF originates in regions on the Sun where the magnetic field is "open", that is, where field lines emerging from one region do not return into a conjugate region but extend virtually indefinitely into space. The direction of the field in the Sun's northern hemisphere is opposite to that of the field in the southern hemisphere. 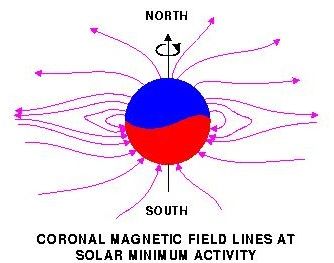
Figure 6. Closed and open magnetic field lines. As the polarity of one solar hemisphere is opposite to polarity of the other hemisphere, the oppositely directed open field lines run parallel to each other and are separated by a thin current sheet known as the “interplanetary current sheet”. The thin current sheet divides IMF into various polarities and is located along the plane of the solar magnetic equator. The Sun rotates on its axis once every 27 days. The Sun's rotational and magnetic axes differ in incline. That is why the IMF has a spiral shape (“ballerina skirt”) and the current sheet is tilted and warped because of the quadrupole moment of the solar magnetic field. 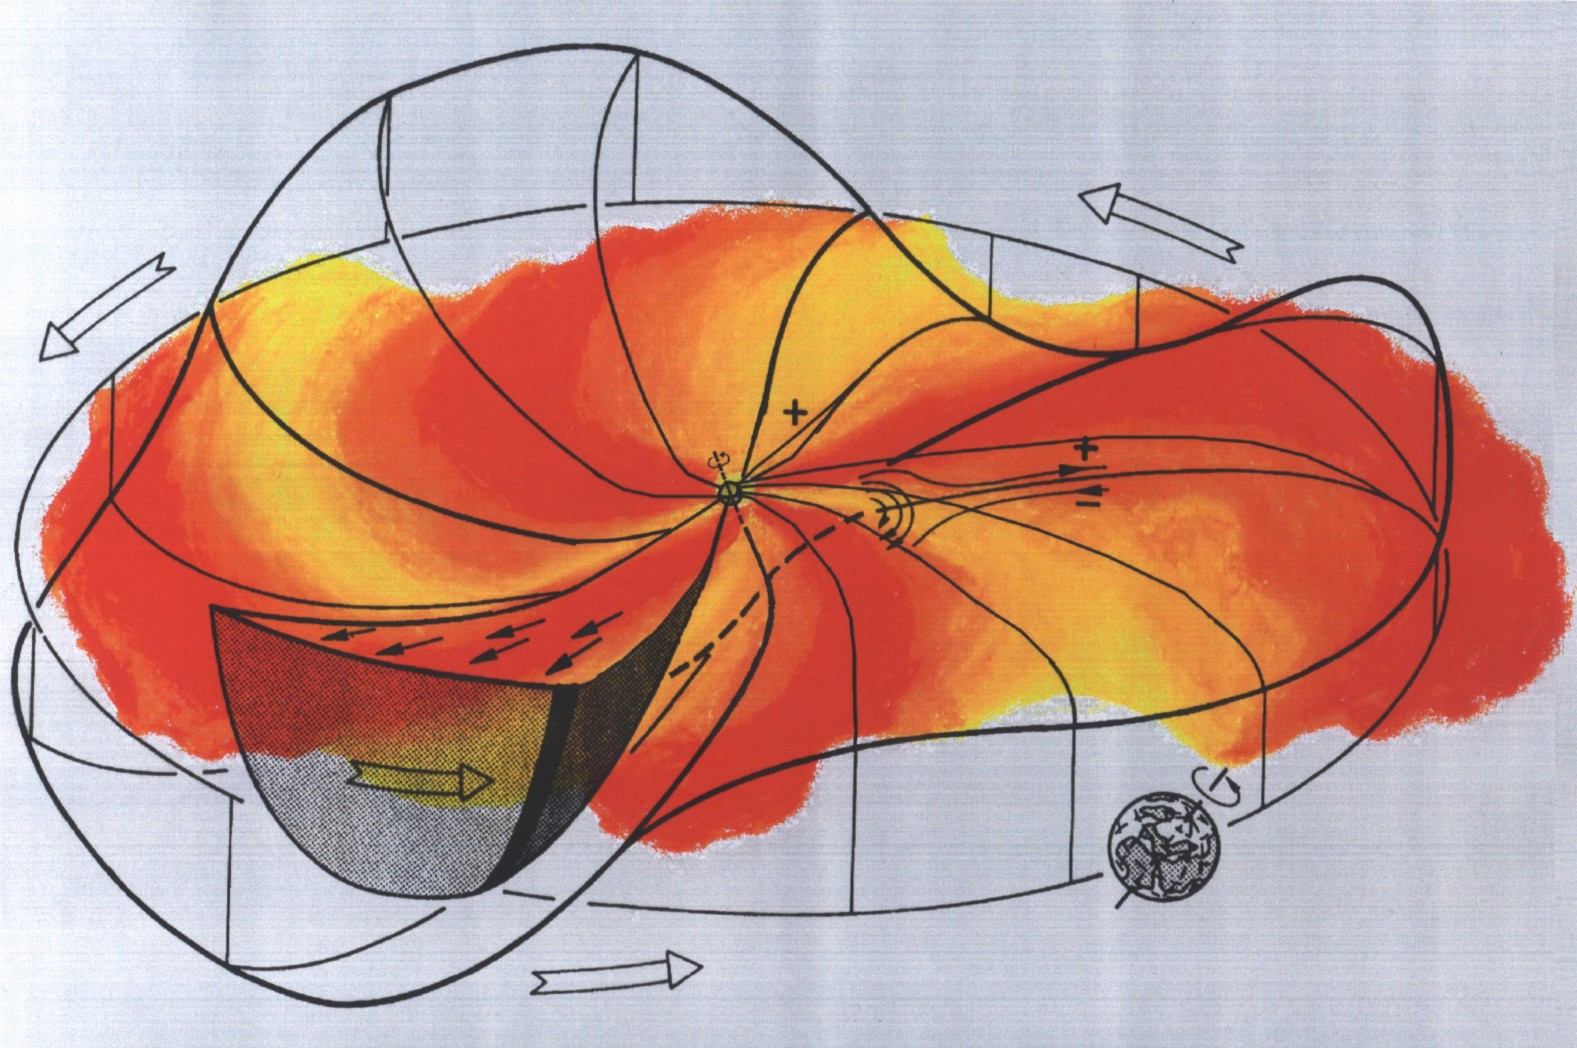
Figure 7. The Parker spiral,named after the scientist who first described it.In the image above, it's easy to see why the neutral current sheet is often called the “ballerina skirt”. The IMF has a sectoral structure with 2, 4 or 6 (very seldom) sectors. At maximum of an 11-year cycle the 2-sector structure of the IMF is observed, and at the phase of decline 4 sector one. 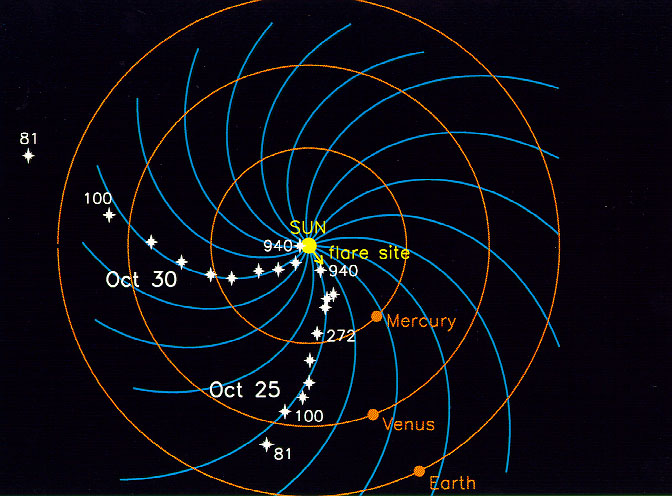
Figure 8. The IMF sectoral structure. At minimum of cycle the sector structure either disappears or becomes 2-sector and remains up to the next maximum. From one sectoral structure to another the magnetic field polarity sign changes. 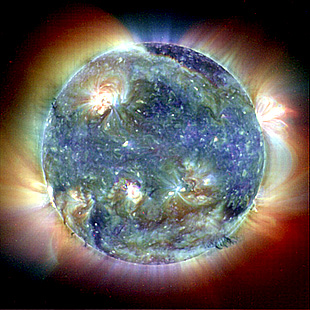
Figure 9. Solar 3-color image in extreme Ultraviolet wavelength region. | |
The Ulysses lunch started a new stage in study of solar wind. The orbit of Ulysses is inclined 800 to the ecliptic plane.
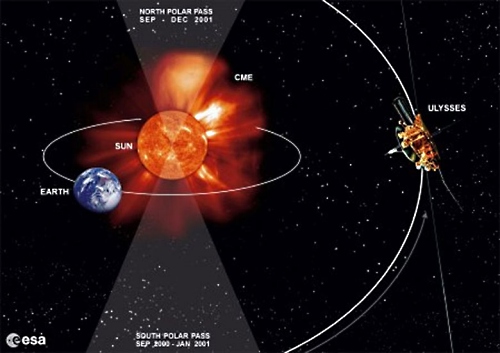
Figure 10. Ulysses, a joint ESA-NASA program managed out of JPL, was launched on October 6, 1990 to monitor several aspects of the heliosphere environment. Detailed measurements of the solar wind from the Sun’s polar regions at solar minimum and maximum were made for the first time. 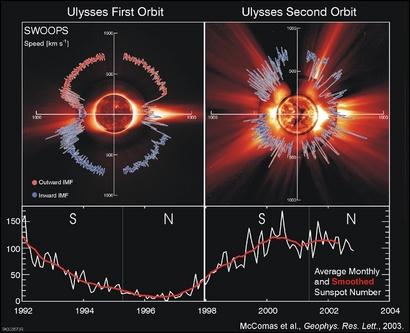
Figure 11. The Solar Wind during two cycles, one during a solar minimum and the other during a maximum. These occur during magnetic pole reversals over an eleven year period. | |
|
In 2007-2008 the approach of maximum of the new 24thcycle of solar activity is expected. For this reason, 2007 is announced International Heliospheric Year, when all devices both from ground and space are directed to the Sun to register a change of the sign of the solar magnetic field and better study nature of our Sun. | |
| 25.07.2005 | |
| Marina GIGOLASHVILI, Dr. of Sciences, Head of Department of the Solar, Planetary and Upper Atmosphere of the Earth, | ADDRESS |
E-mail:marinagig@yahoo.com marinagig@genao.org BACK to Educational Outreach | |
|---|---|