3D potential extrapolation of coronal magnetic field for active regions (AR) 10314 and 10588 was performed. AR 10314 was associated with X-class flare and AR 10588 was associated with C-class flare. Herewith, stronger flare produced flux of solar energetic particles one order of magnitude smaller, compared to weaker flare. Potential extrapolation revealed significant difference in the large-scale magnetic field structure of the two considered ARs. In the AR 10314 a high arcade was revealed, overlapping low lying sigmoid-like structures, while unipolar sunspot of the AR 10588 had substantial amount of opened magnetic field lines. This could be the explanation why the C-class event has a greater particle impact on Earth than the X-class flare.
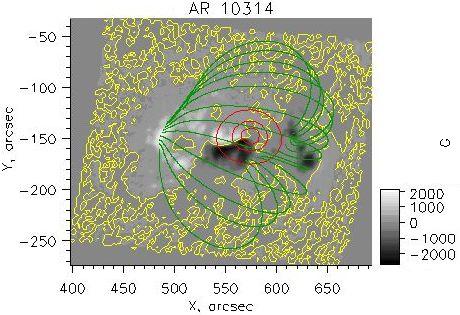
Fig. 1 The white and black background is the radial component of the photosphere magnetic field. Characteristic force lines of the extrapolated magnetic field colored in green. Yellow contours mark neutral line. Red contours show X-ray 12-25 KeV sources by RHESSI (50, 70 and 90% of the maximal intensity).
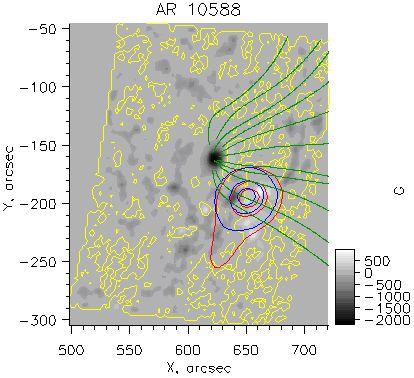
Fig. 2 The same as Fig.1. Blue contours show X-ray 25-50 KeV sources by RHESSI (50, 70 and 90% of the maximal intensity).
In an additional study a solar eruptive prominence was considered. 3D potential extrapolation was performed in order to obtain spatial distribution of the magnetic decay index in the coronal space, identified with the eruptive prominence. Analysis of the time dependent height profile of the prominence revealed that state of equilibrium was lost when prominence's apex reached height of approximately 180-190 Mm. According to SDO/AIA 304 Å images size of the prominence cross-section by the time of the eruption was up to 100 Mm. Assuming the electric current inside the prominence was located along its axis, i.e. about 50 Mm lower than the apex, one can conclude that height of the current is very close to the height at which computed magnetic decay index exceeded critical value 1.5, which is specific for the torus instability.
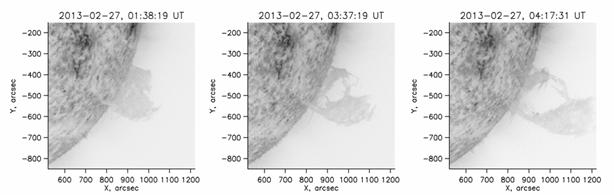
Fig. 3 SDO\AIA 304 Å images of the eruptive prominence.
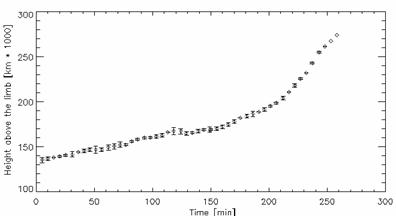
Fig. 4 Time-dependent height profile of the prominence's apex above the limb. The beginning timeline correspond to February 27, year 2013, 0:00 UT.
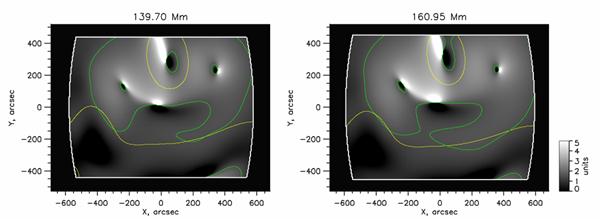
Fig. 5 Spatial distribution of the computed magnetic decay index at two heights above the photosphere, given in titles. Green contours correspond to decay index value equal to 1.5. Yellow contours – neutral line, electric current inside the prominence is identified with the lower horizontal part of the neutral line. Thick white contour marks boundary of the computational domain. Minimal and maximal values of the magnetic decay index are limited to 0 and 5 correspondingly.
Publications
Andrey Bogomolov, Irina Myagkova, Ivan Myshyakov, Tsvetan Tsvetkov, Larisa Kashapova, Rositsa Miteva. Comparative analysis of the proton generation efficiency during 17 March 2003 and 11 April 2004 solar flares, (2018) JASTP, Vol. 179, Pages 517-526 [DOI:10.1016/j.jastp.2018.08.010]
Myshyakov, I., Tsvetkov, Ts., Petrov, N., Comparison of kinematics of the solar eruptive prominence and spatial distribution of the magnetic decay index, Proceedings of Tenth Workshop "Solar Influences on the Magnetosphere, Ionosphere and Atmosphere" Primorsko, Bulgaria, June 4÷8, 2018 pp. 109-113![]()