Coronal mass ejection (CME)-driven shocks are among the physical processes that accelerate solar energetic particles (SEPs) in the corona and interplanetary space. Studies on whether the collision of two or more CMEs could influence the SEP characteristics lead to contradictory results in the past. The current study aims to give a new impact on the topic by evaluating 3D parameters of interacting CMEs and relating them with the occurrence and strength of associated proton events.
We use simultaneous observations of CMEs to determine their 3D kinematic properties:
To combine the data from different coronagraphs and investigate the 3D distribution of interacting CMEs we use StereoCat tool (https://ccmc.gsfc.nasa.gov/analysis/stereo/). The Orbit tool of STEREO Science center (https://stereo-ssc.nascom.nasa.gov/cgi-bin/make_where_gif) illustrates spacecraft positions during eruption.
Related SEP events are explored using data from the Geostationary Operational Environmental Satellite (GOES), SOHO/ERNE, ACE/EPAM and STEREO/IMPACT instruments.
Our case study analyzes two pairs of CMEs - from 2012 March 4 & 5 and from 2011 February 14 & 15 considered as interacting by Colaninno and Vourlidas (2015) and Temmer et al. (2014). Since STEREOCat tool allows common measurements using only 2 spacecraft data at once, we explore both events with all possible combinations of telescopes. The characteristics of the CMEs and associated flares are summarized in Table 1 and measured average 3D properties using the measurements from different instruments (Figure 1) are listed in Table 2.
Table 1. 2D properties and associated flare characteristics for two pairs of interacting SEP-related CMEs.
| Date | Associated flare properties | LASCO 2D properties | |||||||
| yyyy-mm-dd | Class | Onset [UT] | Peak [UT] | End [UT] | Location | Onset [UT] | Linear speed [km/s] | Angular width [ ° ] | Position angle [ ° ] |
2012-03-04 | M2.0 | 10:29 | 10:52 | 12:16 | N19E61 | 11:00 | 1306 | 360 | 52 |
2012-03-05 | X1.1 | 02:30 | 04:09 | 04:43 | N17E52 | 04:00 | 1531 | 360 | 61 |
2011-02-14 | M2.2 | 17:20 | 17:26 | 17:32 | N56W18 | 18:24 | 326 | 360 | 315 |
2011-02-15 | X2.2. | 01:44 | 01:56 | 02:06 | S20W12 | 02:24 | 669 | 360 | 189 |
Table 2. Average 3D properties for each of the interacting SEP-related CMEs.
| March-4 | March-5 | Feb-14 | Feb-15 | |
| Half-Width [°] | 48 | 64 | 21 | 89 |
| Longitude [°] | -43 | -55 | 81 | -26 |
| Latitude [°] | 24 | 43 | -2 | -16 |
| Speed [km/s] | 1416 | 1233 | 2122 | 741 |
Example of the obtained analysis procedure for the 2012 March events is shown below.
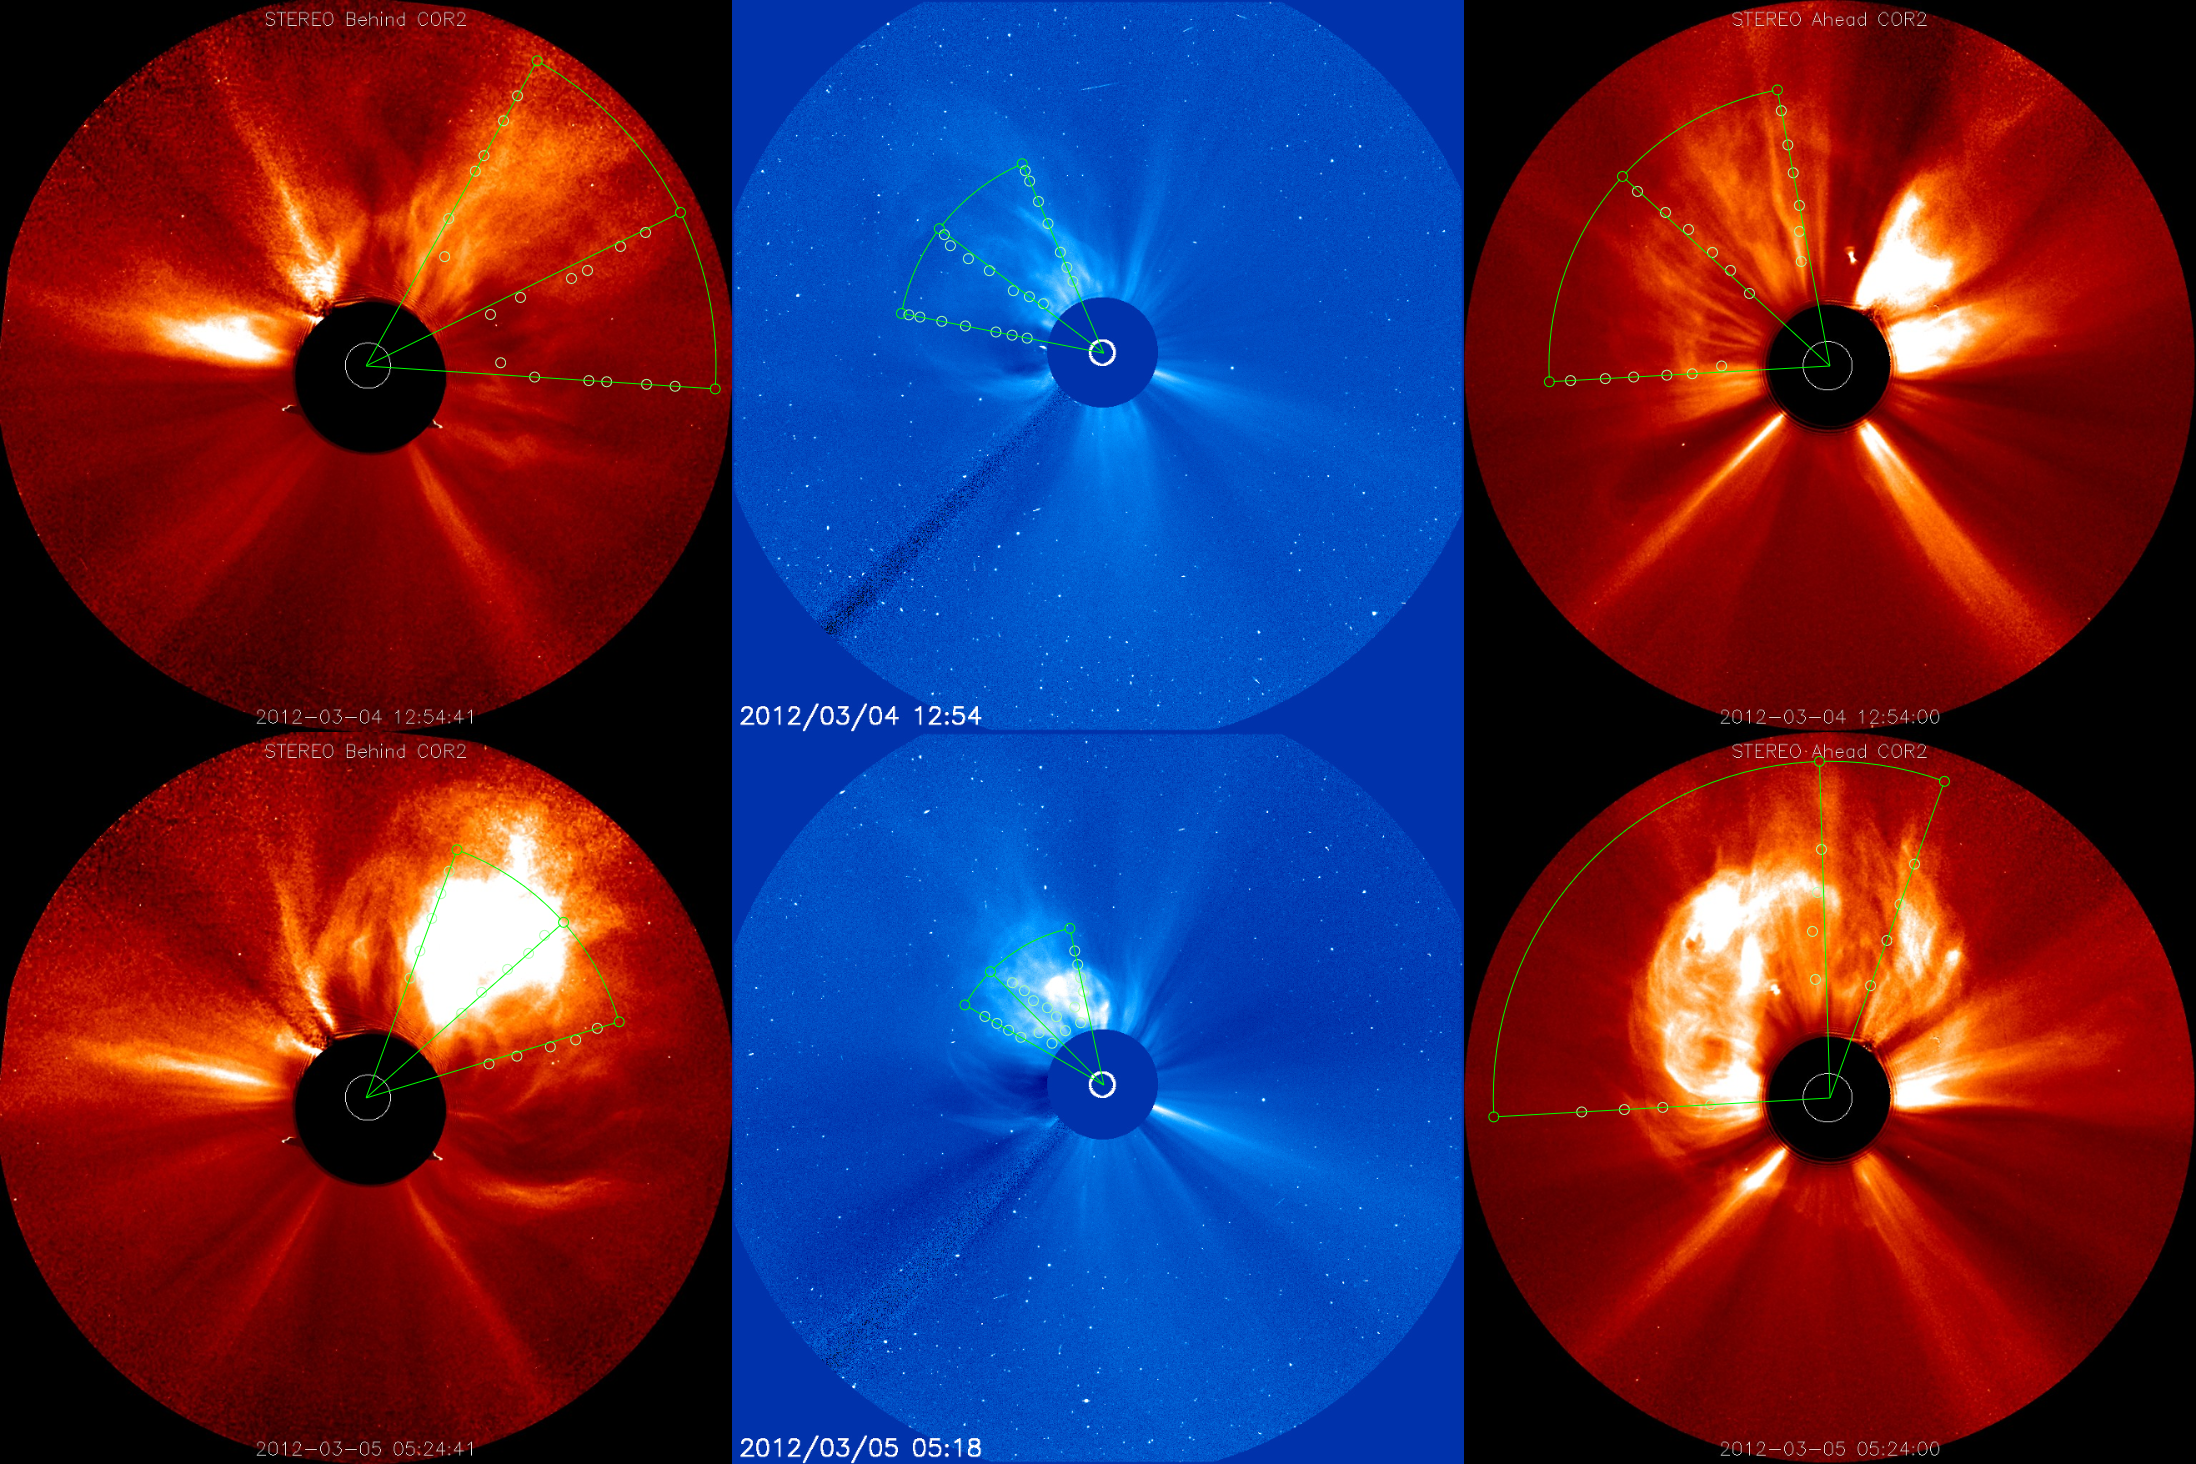
Figure 1. Height-time measurements of the two interacting CMEs from 2012 March 04 (upper row) and March 05 (lower row) obtained from 3 different instruments: STEREO B (left), SOHO/LASCO C3 (middle) and STEREO A (right).
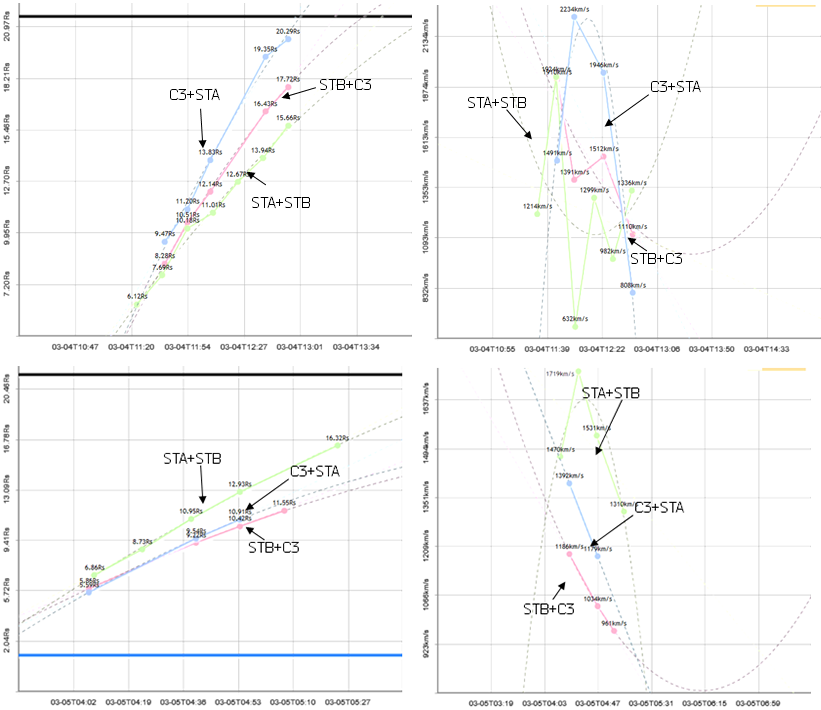
Figure 2. Height-time profiles (left) and 3D speed distributions (right) of 2012 March 04 (upper row) and March 05 (lower row) CMEs obtained from 3 different pairs of instruments (noted with arrows).
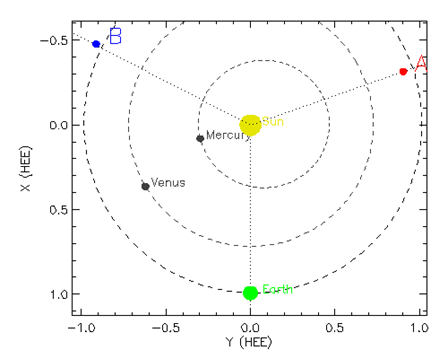
Figure 3. STEREO A & B spacecraft positions at 2012 March 05
00:00 UT.
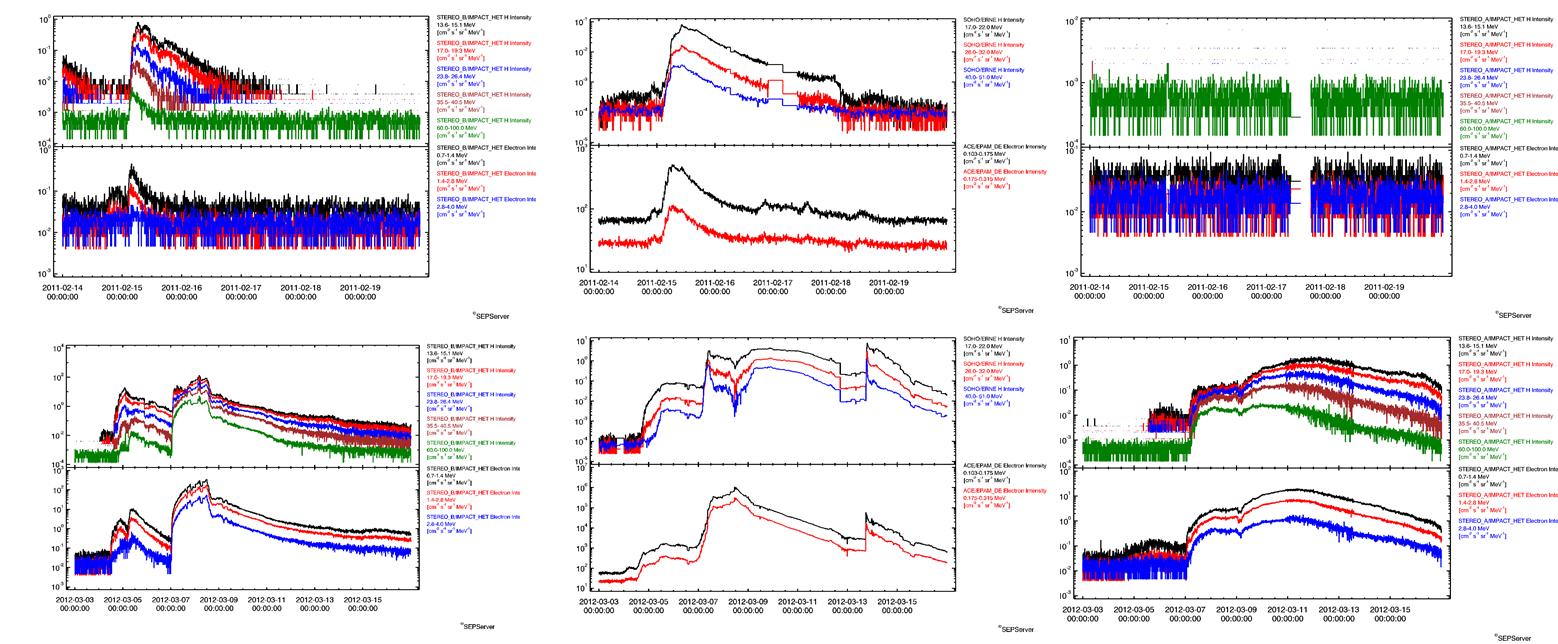
Figure 4. STEREO-B – Earth – STEREO-A SEP profiles.
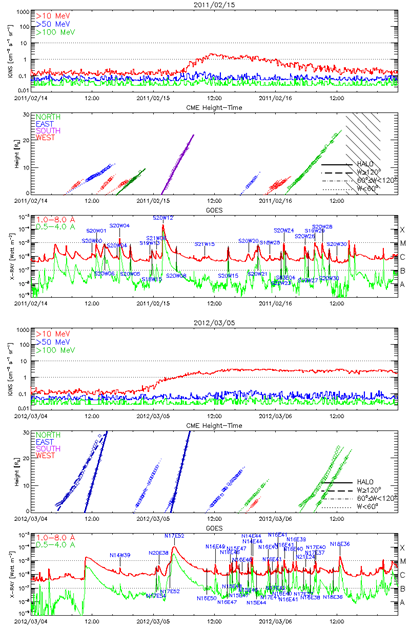
Figure 5. Combined GOES SEP, CME and flare profiles.
We present two case studies of SEP-related interacting coronal mass ejections. Comparison between their 2D and 3D kinematic properties proves the importance of estimating the true CME speeds. According to LASCO/SOHO CME Catalog the two interacting CMEs from 2011 are slow (v < 900 km s-1), while in the other case we have 2 fast events. Our 3D measurements confirm the statement for 2012 CMEs, but show that the ejection from 2011 February 14 is the fastest presented here. For the related SEP events are established the following properties:
References
Colaninno, R. C., Vourlidas, A., 2015,ApJ,815, 70.
Temmer, M., Veronig, A.M., Peinhart, V., Vršnak, B., 2014,ApJ,785, 85.