CMEs are changes in coronal structure including appearance and ejection of bright formation of plasma that can be observed at various wavelengths (white-light, soft X-ray, EUV, etc.). Usually their speeds are estimated in the plane of the sky (which is a projection of their real velocities) and are important part of all CME propagation models as initial conditions. We evaluate the 3D parameters of SEP-related CMEs and estimate if they can give us a better insight of SEP production than the previously used 2D velocities.
For the analysis performed in this study, we used the best observations of CMEs nowadays from the following coronagraphs:
The analysis is done using the StereoCat tool ( https://ccmc.gsfc.nasa.gov/analysis/stereo/ ).
A list of 156 solar energetic particle (SEP) events was obtained for the period of solar cycle 24 (2009÷2017) using data from SOHO/ERNE ~20 MeV energy channel. All events were associated with CMEs and 112/156 events were also linked with solar flares.
We estimated the "true" velocities of SEP-related CMEs with STEREOCat tool, which allows common measurements using only 2 spacecraft data at once. Depending on visibility of eruptions by different instruments we made measurements with all possible combinations of telescopes. 41/156 CMEs were observed simultaneously by the 3 instruments and we estimated 3 values for their 3D speeds (STEREO A + LASCO C3; STEREO A + STEREO B; LASCO C3 + STEREO B). Since no STEREO Ahead data is available for the period 2014 July ÷ 2015 November and after October 2014 STEREO Behind is out of order, measurements for 28/156 events observed in this periods are impossible. 8/156 CMEs are only observed simultaneously by STEREO B and C3 (in the period of STEREO A data gap) and in other 9 cases the only possible combination includes STEREO A and C3 data (after communications with STEREO B dropped down ).
Finally, we have 64 measurements by the pair STEREO A and LASCO C3, 56 calculations by STEREO A and STEREO B and 53 – by LASCO C3 and STEREO B. We plotted the distributions of the 3D velocities by each pair as well as the distribution of 2D velocity quantified by LASCO CME Catalog (Figure 1). The average and median velocities in each case show that we have similar values from the 3 different combinations of instruments that estimate 3D speeds (average velocities between 1220 and 1273 km s-1 and median velocities 1148÷1156 km s-1), but they differ from the values obtained by the 2D sample (average and median speeds, 1003 km s-1 and 928 km s-1, respectively).
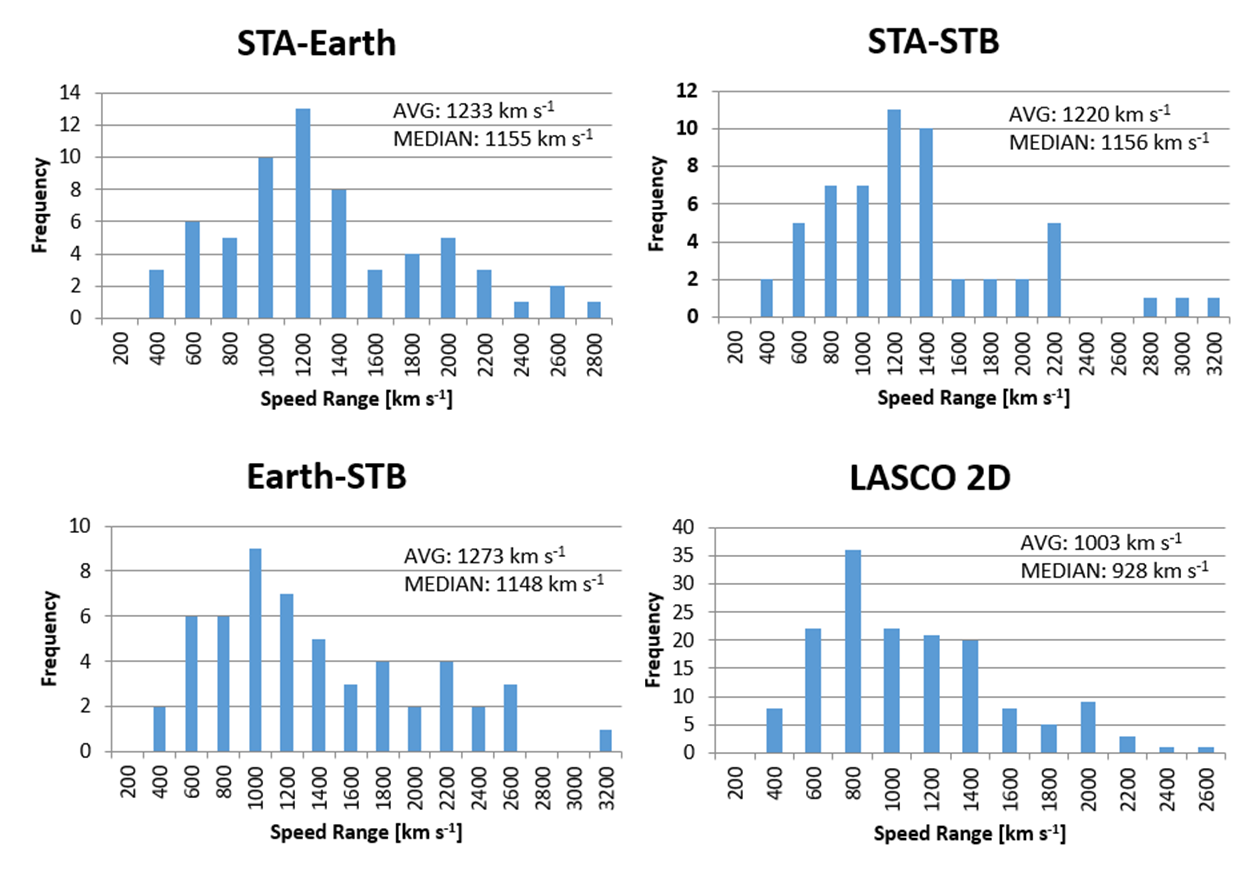
Figure 1. Distributions of "true" 3D velocities of SEP-related CMEs measured by simultaneous observations from different pairs of coronagraphs compared to 2D LASCO/SOHO velocities distribution.
To compare the calculated velocities with LASCO 2D CME speeds we plotted the dependence and estimated Pearson product-moment correlation coefficient r for each plot ( Figure 2 ). The most powerful relation with 2D speeds seems to be with the velocities measured by STEREO A + LASCO C3 pair, although other pairs also show high positive correlation with 2D velocities. The uncertainties are calculated using bootstrapping method based on a sample of 1000 calculated correlations.
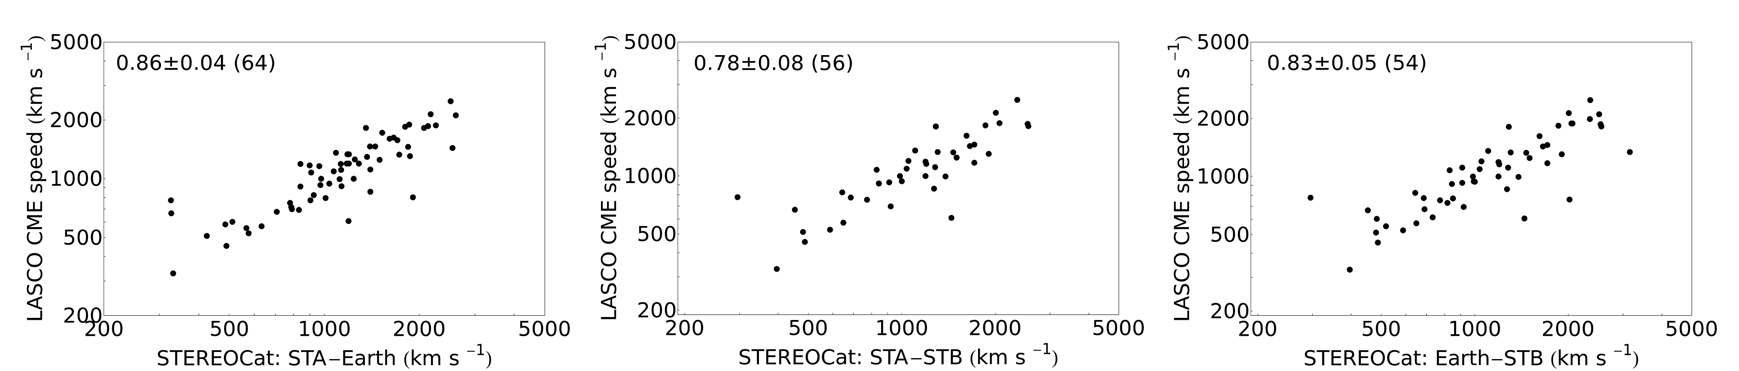
Figure 2 . Graphical representation of the dependence between the 3D velocities of SEP-related CMEs and 2D LASCO/SOHO velocities. In the upper left corner of every plot is given the Pearson product-moment correlation coefficient.
Pearson correlation coefficients are calculated to reveal a relationship between the characteristic of SEP-related event (CME or flare) and the peak intensity of the SEP event, detected on 20 MeV by SOHO/ERNE. Results are listed in the Table.
| Properties | No. of events | r | r2 ×100 |

| Flare class | 112 | 0.42±0.07 | 18% |
| 2D LASCO CME speed | 156 | 0.55±0.05 | 30% | |
| ST A+C3 CME speed | 64 | 0.47±0.09 | 22% | |
| ST A+ST B CME speed | 56 | 0.47±0.11 | 22% | |
| C3+ST B CME speed | 54 | 0.42±0.11 | 18% |
The highest correlation again is with 2D LASCO speeds, although STEREO A combinations with C3 and STEREO B also give close value.
Our results show that 3D speed are in general larger than the SOHO/LASCO projected speeds. Correlation coefficients while using the 3D speed are smaller than those when using 2D speeds, although the differences are within the statistical uncertainty. Thus, LASCO CME speeds tend to overestimate the relevance of CMEs as the origin of SEP events, at least in a statistical sense.